You can not select more than 25 topics
Topics must start with a letter or number, can include dashes ('-') and can be up to 35 characters long.
|
|
3 years ago | |
|---|---|---|
| .. | ||
| README.md | 3 years ago | |
| latency_logger.py | 3 years ago | |
README.md
LatencyLogger
LatencyLogger is a tool to track the time from first pixel to actuation. Timestamps are printed in a table as well as plotted in a graph. Start openpilot with LOG_TIMESTAMPS=1 set to enable the necessary logging.
Usage
$ python latency_logger.py -h
usage: latency_logger.py [-h] [--relative] [--demo] [--plot] [route_or_segment_name]

A tool for analyzing openpilot's end-to-end latency

positional arguments:
  route_or_segment_name
                        The route to print (default: None)

optional arguments:
  -h, --help            show this help message and exit
  --relative            Make timestamps relative to the start of each frame (default: False)
  --demo                Use the demo route instead of providing one (default: False)
  --plot                If a plot should be generated (default: False)
To timestamp an event, use LOGT("msg") in c++ code or cloudlog.timestamp("msg") in python code. If the print is warning for frameId assignment ambiguity, use LOGT(frameId ,"msg").
Examples
Plotting with relative starts each process at time=0 and gives a nice overview. Timestamps are visualized as diamonds. The opacity allows for visualization of overlapping services.
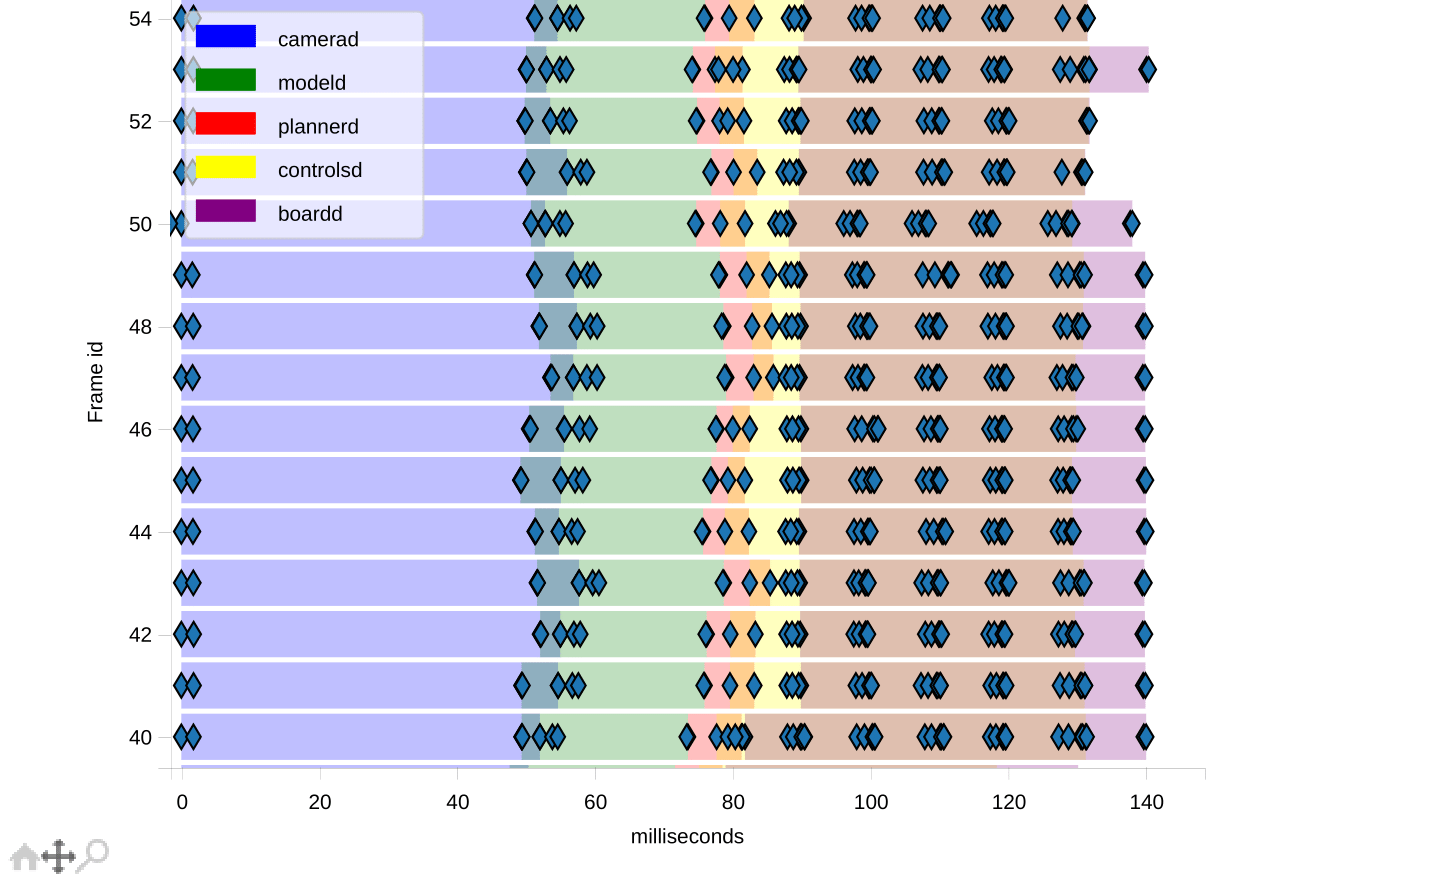
Plotting without relative provides info about the frames relative time.

Printed timestamps of a frame with internal durations.
Frame ID: 371
  camerad
    wideRoadCameraState start of frame                   0.0
    roadCameraState start of frame                       0.072395
    wideRoadCameraState published                        47.804745
    WideRoadCamera: Image set                            47.839849
    roadCameraState published                            48.319166
    RoadCamera: Image set                                48.354478
    RoadCamera: Transformed                              48.430258
    wideRoadCameraState.processingTime                   16.733376309275627
    roadCameraState.processingTime                       16.218071803450584
  modeld
    Image added                                          51.346522
    Extra image added                                    53.179467
    Execution finished                                   71.584437
    modelV2 published                                    71.76881
    modelV2.modelExecutionTime                           22.54236489534378
    modelV2.gpuExecutionTime                             0.0
  plannerd
    lateralPlan published                                77.381862
    longitudinalPlan published                           84.207972
    lateralPlan.solverExecutionTime                      1.3547739945352077
    longitudinalPlan.solverExecutionTime                 2.0179999992251396
  controlsd
    Data sampled                                         78.909759
    Events updated                                       79.711884
    sendcan published                                    80.721038
    controlsState published                              81.081398
    Data sampled                                         88.663748
    Events updated                                       89.535403
    sendcan published                                    90.587889
    controlsState published                              91.019707
    Data sampled                                         98.667003
    Events updated                                       99.661261
    sendcan published                                    100.776507
    controlsState published                              101.198794
    Data sampled                                         108.967078
    Events updated                                       109.95842
    sendcan published                                    111.263142
    controlsState published                              111.678085
    Data sampled                                         118.574923
    Events updated                                       119.608555
    sendcan published                                    120.73427
    controlsState published                              121.111036
    Data sampled                                         128.596408
    Events updated                                       129.382283
    sendcan published                                    130.330083
    controlsState published                              130.676485
  boardd
    sending sendcan to panda: 250027001751393037323631   90.7257
    sendcan sent to panda: 250027001751393037323631      91.078143
    sending sendcan to panda: 250027001751393037323631   100.941766
    sendcan sent to panda: 250027001751393037323631      101.306865
    sending sendcan to panda: 250027001751393037323631   111.411786
    sendcan sent to panda: 250027001751393037323631      111.754074
    sending sendcan to panda: 250027001751393037323631   120.875987
    sendcan sent to panda: 250027001751393037323631      121.188535
    sending sendcan to panda: 250027001751393037323631   130.454248
    sendcan sent to panda: 250027001751393037323631      130.757994
    sending sendcan to panda: 250027001751393037323631   140.353234